This article is part of our series on subscription strategies, whether you’re looking to launch your subscription offer or optimize an existing one. 😃
This series covers all aspects of the topic: acquisition, conversion, customer retention, and KPIs.
With increasingly fierce competition and ever-growing volumes of data, having a clear and holistic view is essential for effective operations management.
Dashboards play a crucial role in this context.
While marketing storytelling sometimes dazzles us with brilliant moves—particularly those enchanting narratives where serendipity triggers a jackpot—being data-driven is undeniably key to achieving performance and sustainable growth.
In this context, what do dashboards offer us? How can we configure and use them to optimize your strategies?
The point in this article 😃
Dashboard: Definition and use
Definition
A dashboard goes beyond the concept of a “report.” It is a dynamic platform that compiles multiple data sources in real-time.
Unlike a report, which involves a one-time analysis, a dashboard provides a global and continuous perspective and allows direct interaction with the data.
Beyond centralizing and providing access to your KPIs, it is also a true data visualization tool.
It transforms raw data into charts, intuitive tables, maps, and other diagrams to synthesize complex information and simplify its understanding.
These tools often include advanced features that enhance their effectiveness:
- Data Visualization allows users to modify data views based on specific criteria.
- Drill-down facilitates detailed exploration for deeper analysis through a series of filters.
- Alerts trigger instant notifications in case of significant trend changes.
- Sharing and Collaboration Options ease data management between different teams.
- APIs ensure easy connection to various data sources.
Different uses of dashboards
Dashboards are essential across all professions. They provide key tools for monitoring and analyzing important information:
- Customer Indicators: Analyzing behavior and preferences to refine conversion strategies and increase engagement.
- Financial Information: Provides monitoring of cash flow, expenses, and revenues for accurate financial management.
- Sales Tracking: Examines sales trends to adjust commercial strategies and maximize revenue.
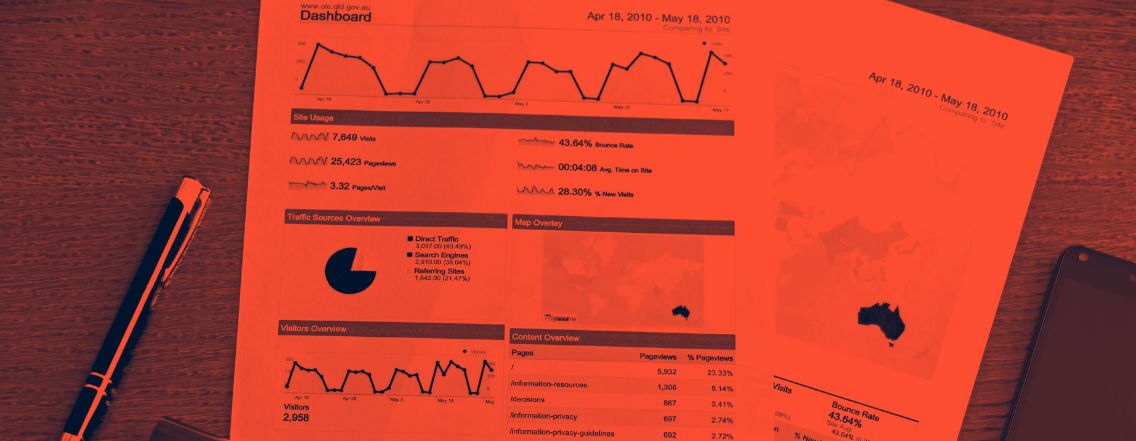
- Website Audience Analytics: Evaluates the effectiveness of acquisition channels and site conversion rates.
- Human Resources Data: Tracks employee performance and key indicators, facilitating managerial management.
- Marketing Performance: Measures the effectiveness of advertising campaigns and promotional strategies, allowing precise budget adjustments.
- Logistics Information: Optimizes supply chains and distribution processes, improving operational efficiency and reducing costs.
Dashboard and marketing: A powerful duo?
Dashboards enable real-time monitoring of action effectiveness, performance analysis over a given period, and the identification of the most promising strategies and those requiring adjustments.
Identifying trends
Dashboards allow for rapid data analysis. They reveal market trends and changes in consumer behavior.
For instance, if a dashboard shows high demand for wellness products during winter months, a company can adjust its marketing strategy to highlight its health and wellness products during this period.
This helps in aligning with consumer expectations and optimizing advertising campaigns to target customers’ specific interests effectively.
Conducting A/B tests
Serving as a basis for A/B tests, dashboards also help evaluate their effectiveness: target, value proposition, design, wording, etc.
Improving internal communication
By centralizing information, dashboards ensure that all team members access the same data in real-time.
This proves particularly useful during meetings, as each team member can view ongoing performance, facilitating consensus decision-making.
Reacting to problems
Marketing dashboards also play a crucial role in quickly detecting performance drops or technical issues.
These instant notifications minimize financial loss risks and ensure smooth marketing operations: Ads, SEO, marketing automation, etc.
Let’s be clear: in a competitive environment where every detail counts, the ability to react quickly is no longer an option but a necessity.
Steps to create your marketing dashboards
1. Define the Most Important KPIs Based on Your Objectives (OKRs)
To create an effective marketing dashboard, start by identifying KPIs related to your overall objectives (OKRs).
These key performance indicators should reflect critical aspects of your strategy and provide clear insights into your marketing actions.
Examples of KPIs include:
- MRR (Monthly Recurring Revenue): Calculates the monthly recurring revenue from subscriptions. This KPI helps estimate future revenues considering new subscribers, growth forecasts, and churn rate.
- LTV (Lifetime Value): Represents the total revenue expected over a customer’s lifetime. It indicates the average revenue a customer generates.
- Churn Rate: Measures the percentage of lost customers or subscribers. The churn rate is crucial and can be reduced through retention strategies.
- CAC (Customer Acquisition Cost): Calculates the average amount spent to acquire a new customer. CAC can include only marketing actions (CAC marketing) or all company structure costs (CAC global).
2. Collect the Data and All Necessary KPIs
For a successful dashboard, ensure that your data sources are reliable and stable.
Examples of data sources you can collect from various platforms include:
- Social Media (Facebook, LinkedIn, TikTok): Provides data such as impressions, shares, likes, and interactions, which are crucial for evaluating campaign engagement and reach.
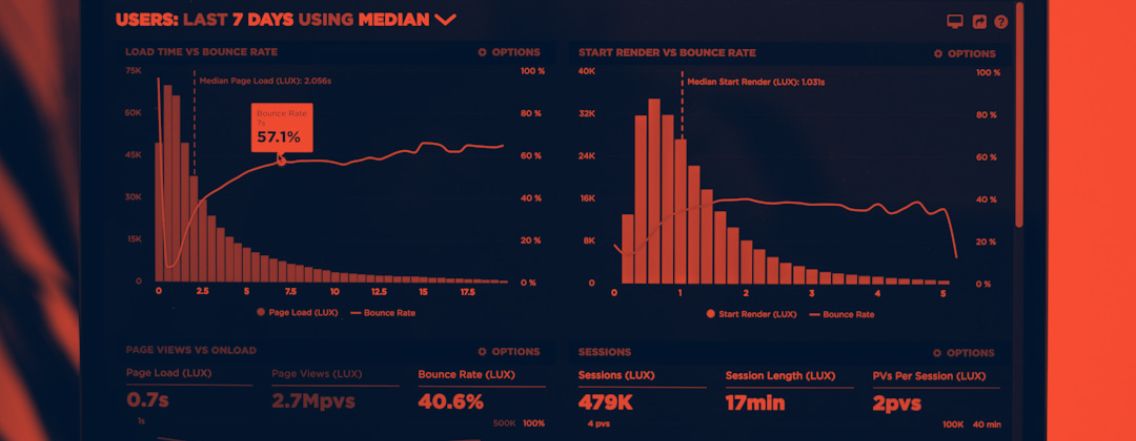
- Google Analytics: Measures site traffic, conversion rates, session duration, bounce rate, SEO/SEA balance, and other user behavior metrics on your site.
- CRM (Salesforce, HubSpot): These systems track customer interactions, conversions, and retention by providing detailed data on customer activities and sales.
Each source offers unique data. Their integration into a dashboard allows you to effectively monitor the performance of your marketing strategies across different channels.
3. Organize These KPIs According to Your Funnel (A)AARRR
Arrange metrics according to the stages of your (A)AARRR funnel for structured and relevant analysis.
| Objective | Metrics to track | Metrics to optimize | |
| Awareness | Increase brand visibility | Number of ad impressions, social media posts, SEO ads | Reach (number of impressions), impression growth rate |
| Acquisition | Generate traffic to the website | Conversion rate of communication media, traffic sources | Traffic/Reach, click-through rate (CTR) |
| Activation | Qualify leads | Website conversion rate, user interaction rate | Leads/Trafic, taux d’inscription |
| Revenue | Convert leads into customers | Sales funnel conversion rate, ARR (Annual Recurring Revenue), CA (Turnover) | Customer/Leads, average transaction value |
| Retention | Create repeat business | Number of active customers, churn rate, frequency of purchases | Churn rate, customer lifetime |
| Referral | Transform customers into ambassadors | Number of referrals per customer, recommendation rate (NPS) | Number of referrals per customer, recommendation rate (NPS) |
4. Choose the Format of Your Reports
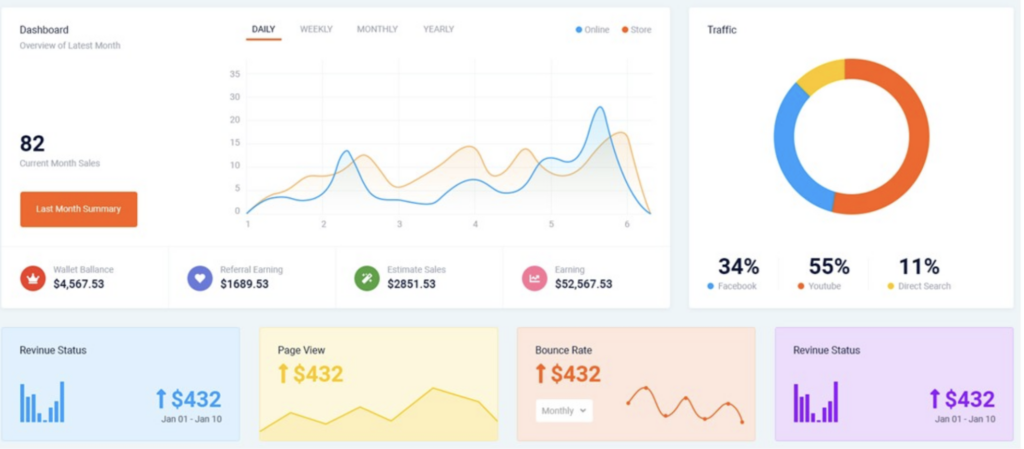
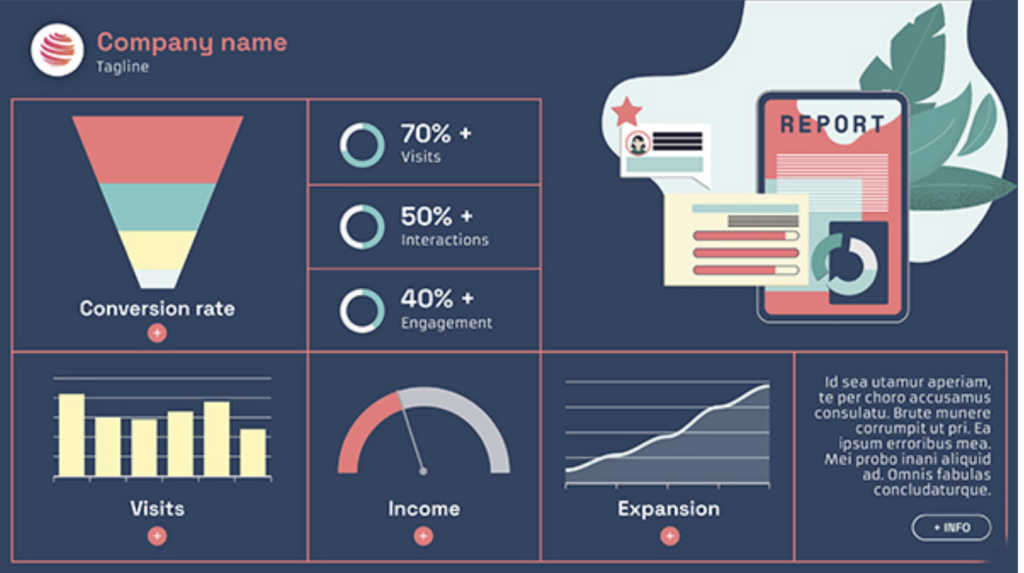
Select visualization formats that best represent your data: diagrams, charts, maps, etc.
For instance, bar and pie charts are useful for comparing values but can become confusing with too much information.
Take time to select visualizations that are easiest for the majority to understand.
Examples of Formats:
- Diagrams: To compare performance across different segments.
- Line Charts: To track KPI trends over time.
- Heat Maps: To visualize high activity or engagement areas.
- Pivot Tables: For detailed and segmented analysis.
Many Business Intelligence tools offer templates to help create your dashboards. These pre-configured models save time and ensure professional data presentation.
5. Monitor performance and optimize
Regularly track KPI performance to identify areas for improvement.
Adjust strategies based on collected data and optimize dashboards to continue meeting company objectives.
By following these steps, you will create effective marketing dashboards that facilitate strategic decision-making and improve overall business performance.
Dashboard Tools
Automatically centralizing KPIs in a dashboard provides a comprehensive view of company performance, facilitating decision-making.
Here are some useful tools for this purpose:
- Looker (formerly Google Data Studio), Power BI, and Tableau: These tools create customized and dynamic reports.
Looker is natively integrated with Google Analytics, Power BI offers interactive visualizations from various data sources, and Tableau is known for its advanced visualization capabilities.
These tools transform complex data into clear visualizations, making real-time performance understanding easier.
- CRM Systems like HubSpot: These customer relationship management systems do more than track interactions. For example, HubSpot integrates website data to offer a comprehensive view of marketing and sales activities.
Users can access KPIs directly on the dashboard, allowing them to see updated data continuously.
- Dynamic Screenshot Tools: Services like Kaptr.me create dynamic screenshots of various tools.
This is ideal for software without native integration, as these screenshots can be aggregated in one place.
Best Practices for Dashboard Management
To maximize the effectiveness of dashboards, follow these best practices:
- Align Data Sources: Use the same sources for reliable comparisons over time.
- Clear and Intuitive Interface: A simple user interface encourages regular interaction. Ensure that the most important elements are easily accessible.
- Automatic Updates: Choose tools that offer regular updates to keep dashboards reflective of reality.
- Data Security: Protect sensitive information with access controls and robust security protocols. Ensure compliance with GDPR and other applicable regulations.
- User Training: Organize workshops to help users understand and fully utilize dashboard features.
- Regular Testing: Regularly test the dashboard to identify and fix bugs as they arise.
FAQ
What is a dashboard?
A dashboard is a data visualization tool that allows you to monitor, analyze, and visually present various sets of business data.
It consolidates important information on a single screen to facilitate quick, data-driven decision-making.
How to create a good dashboard?
To create a good dashboard, clearly define objectives, choose relevant key performance indicators (KPIs), and design an intuitive user interface.
Data organization should enable easy and quick reading, with clear visualizations and real-time updates.
How does a dashboard work?
A dashboard works by collecting data from various sources, processing it, and displaying it in the form of charts, tables, and indicators.
Users can interact with these visualizations to obtain additional details or process the displayed data according to their specific needs.
Read also :
→ Usage Economy: Definition and perspective on sustainable consumption
→ Everything you need to know about the Freemium Model
→ All the benefits of the Subscription Business Model
→ Master OKRs: The key to achieving your strategic goals
→ AARRR: The essential framework for driving business growth